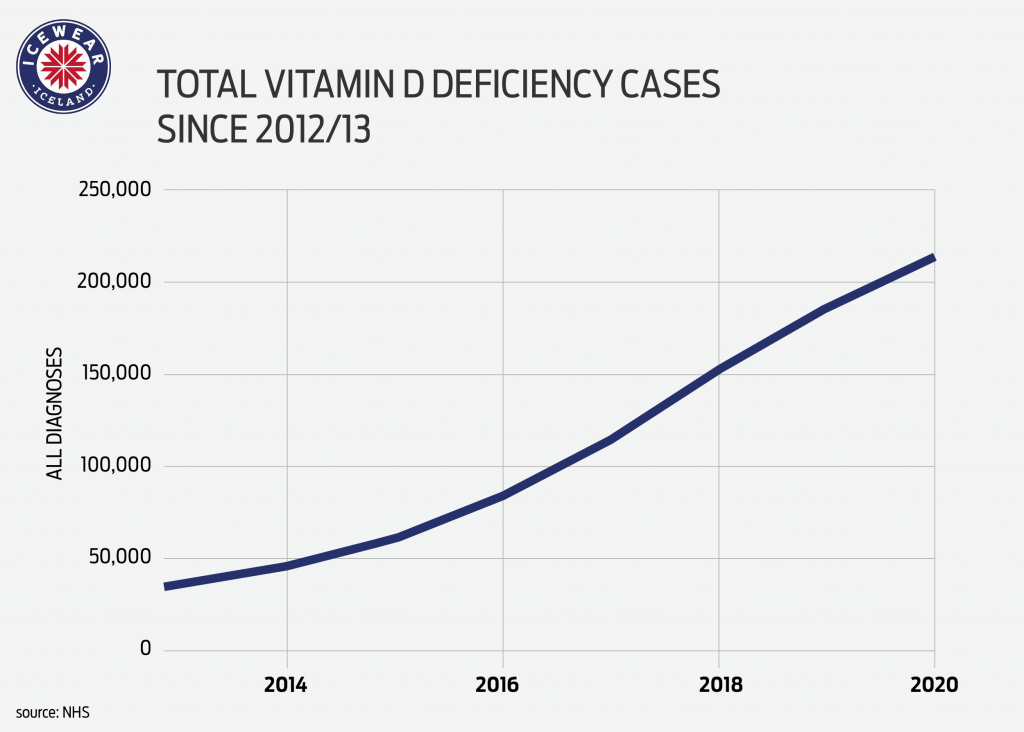
Since the turn of the millennium, cases of Vitamin D deficiency have risen by 490%, with more than 213,000 primary and non-primary cases between 2019 and 2020.
With this in mind, we wanted to understand how the four (4) main categories of days - work, rest, fueling, and fun - have changed over the decades and if the technology boom of the 21st century is leading to a fall in time we spend outdoors, something that can help to boost our Vitamin D intake and production.
Analysing data from the University College London (UCL) Multinational Time Use Study (MTUS), we’ve explored how our daily activities have changed since the 1970s, with an emphasis on how our outdoor activities and leisure pursuits have been impacted by the personal technology boom of the past few decades.
CONTENTS:
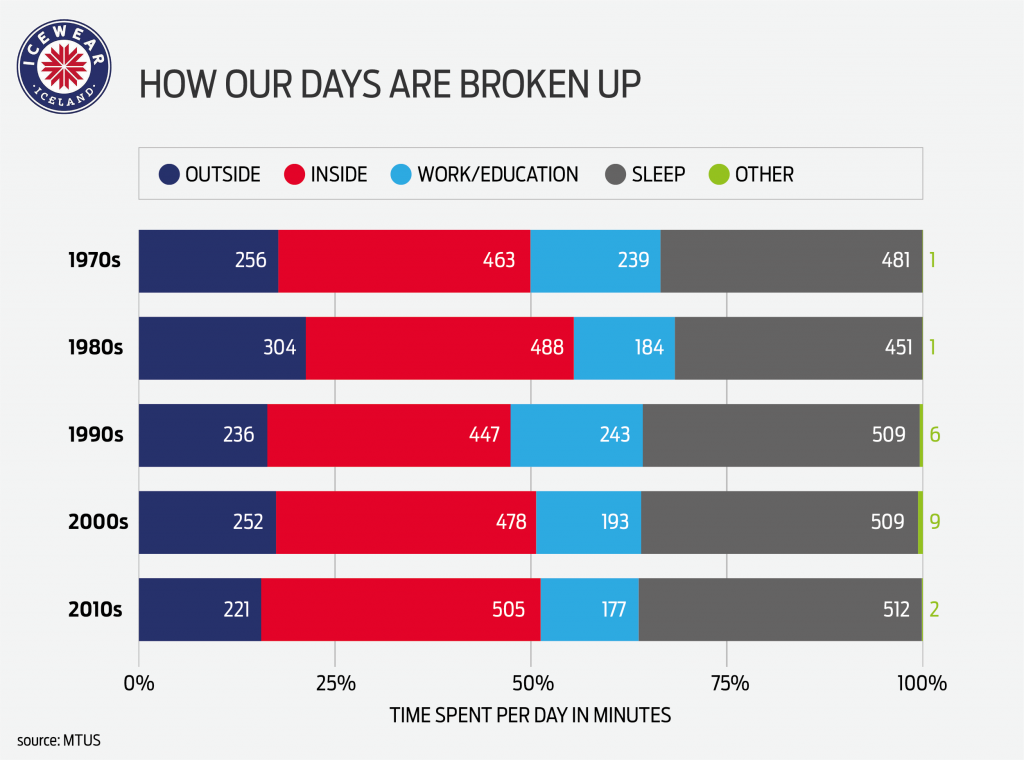 According to our analysis of the latest MTUS data, of the 1,440 minutes in a day, an average of just 3.7 hours (221) per day can be attributed to time ‘outdoors’, the equivalent to just 15% of a full day. In comparison, our time indoors is more than double that of ‘outdoors’ time, the equivalent of 35% of a 24 hour day.
Taking into account sleeping (36%) and working or in education (12%), for many working-age people (16-65), we spend upwards of 85% of our lives inside. A far cry from the amount of time our ancestors enjoyed.
According to our analysis of the latest MTUS data, of the 1,440 minutes in a day, an average of just 3.7 hours (221) per day can be attributed to time ‘outdoors’, the equivalent to just 15% of a full day. In comparison, our time indoors is more than double that of ‘outdoors’ time, the equivalent of 35% of a 24 hour day.
Taking into account sleeping (36%) and working or in education (12%), for many working-age people (16-65), we spend upwards of 85% of our lives inside. A far cry from the amount of time our ancestors enjoyed.
 Taking into account various outdoor activities (or those that involve leaving the house and being outdoors for some time), our analysis of the MTUS data found there has been a 22% (61 minute) drop in the share of time spent outdoors by those of working age (16-65) between the years of 1974 and 2015.
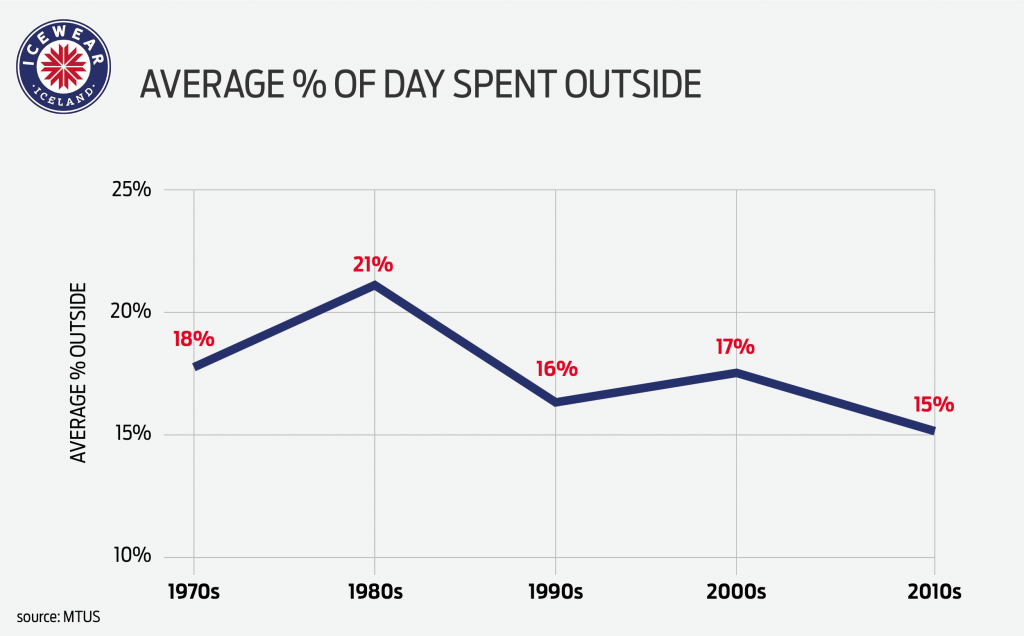
 However, whilst this provides a year snapshot, it only tells some of the story. Looking at the average time ‘outside’, our analysis found that between the 1970s and 2010s there has been a 14% (35 minute) drop in the time people take part in activities listed as involving “all or some outdoor time”.
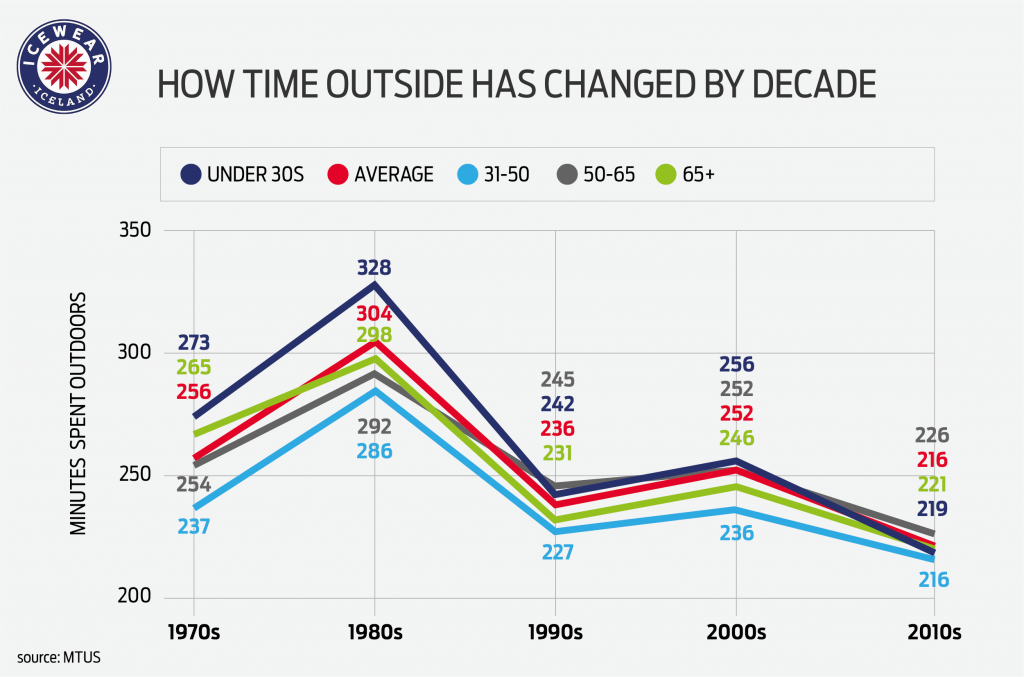
Those under 30 (16-30), have seen the biggest drop in ‘outdoor’ time (20%), when compared to their age bracket in the 1970s, a fall of 54 minutes.
Though all the age groups analysed saw a drop in the fall in the time spent ‘outdoors’ those between the ages of 31 and 50 saw the smallest decrease (9%), followed by those between 50 and 65 (11%); 21 minutes and 28 minutes respectively.
The latest 12% drop in the percentage of time outdoors coincides with a 490% increase in Vitamin D deficiency diagnoses.
However, whilst this provides a year snapshot, it only tells some of the story. Looking at the average time ‘outside’, our analysis found that between the 1970s and 2010s there has been a 14% (35 minute) drop in the time people take part in activities listed as involving “all or some outdoor time”.
Those under 30 (16-30), have seen the biggest drop in ‘outdoor’ time (20%), when compared to their age bracket in the 1970s, a fall of 54 minutes.
Though all the age groups analysed saw a drop in the fall in the time spent ‘outdoors’ those between the ages of 31 and 50 saw the smallest decrease (9%), followed by those between 50 and 65 (11%); 21 minutes and 28 minutes respectively.
The latest 12% drop in the percentage of time outdoors coincides with a 490% increase in Vitamin D deficiency diagnoses.
 *However, when we compare the numbers of cases in 2000 (85) to 2019’s (965), we found diagnoses have increased by 987% in that time, at an average rate of 18% per year.*
Whilst primary diagnoses provide a snapshot of severe cases and their growth since 1999, the latest reports provide further insight into the numbers of diagnoses at primary and ‘total’ split.
Analysing the latest figures (between 2013 and 2020), we found “all” diagnoses of Vitamin D deficiency have increased from 36,912 to 213,297, an increase of 477%.
Some of this change can be attributed to more younger people spending longer in education rather than entering the workforce.
The figures analysed showed, since the 1970s, a 138% increase in the amount of time 16-65s spent daily in an educational activity, with those between the ages of 16 and 21 seeing a time spent in education increase of 180% (70 minutes).
In response to the findings of our study, Harpa Gretarsdóttir, Brand manager here at Icewear comments:
“Our study shows that for many people their time outdoors has seen fall, with time spent each day consuming home entertainment increasing by 25%, to an average of 187 minutes (3.1 hours) per day.”
“With this in mind, along with fact, people are spending just 15% of their day in ‘outdoor’ activities, it is not too surprising to learn that Vitamin D deficiency cases have risen by 490% between the 2000s and 2010s.”
“Here in Iceland, to counter our dark winters that see our time outdoors greatly reduced, many people turn to fish oils (Lýsi) and vitamins to give them Vitamin D boosts they need to get through the months.”
“Icelanders will also look to take advantage of time outdoors when they can, either through exercising or generally getting out of the house to visit friends and for a change of scenery.”
*However, when we compare the numbers of cases in 2000 (85) to 2019’s (965), we found diagnoses have increased by 987% in that time, at an average rate of 18% per year.*
Whilst primary diagnoses provide a snapshot of severe cases and their growth since 1999, the latest reports provide further insight into the numbers of diagnoses at primary and ‘total’ split.
Analysing the latest figures (between 2013 and 2020), we found “all” diagnoses of Vitamin D deficiency have increased from 36,912 to 213,297, an increase of 477%.
Some of this change can be attributed to more younger people spending longer in education rather than entering the workforce.
The figures analysed showed, since the 1970s, a 138% increase in the amount of time 16-65s spent daily in an educational activity, with those between the ages of 16 and 21 seeing a time spent in education increase of 180% (70 minutes).
In response to the findings of our study, Harpa Gretarsdóttir, Brand manager here at Icewear comments:
“Our study shows that for many people their time outdoors has seen fall, with time spent each day consuming home entertainment increasing by 25%, to an average of 187 minutes (3.1 hours) per day.”
“With this in mind, along with fact, people are spending just 15% of their day in ‘outdoor’ activities, it is not too surprising to learn that Vitamin D deficiency cases have risen by 490% between the 2000s and 2010s.”
“Here in Iceland, to counter our dark winters that see our time outdoors greatly reduced, many people turn to fish oils (Lýsi) and vitamins to give them Vitamin D boosts they need to get through the months.”
“Icelanders will also look to take advantage of time outdoors when they can, either through exercising or generally getting out of the house to visit friends and for a change of scenery.”
- Key Findings
- How Has Time Spent Changed Since The 1970s?
- Time Spent Outside
- Increasing Vitamin D Deficiencies
- Time Spent Inside
- Methodology & Sources
Key Findings
- The average time ‘outdoors’ has fallen 14% (35 minutes) between the 1970s and 2010s
- 16 to 30 year olds have seen the biggest drop in ‘outdoor’ time (20%), when compared to their age bracket in the 1970s
- Primary cases of Vitamin D deficiency rose by 490% between the 2000s and 2010s
- The average person spends a third (36%) of day sleeping, an increase of 31 minutes since the 1970s
- Daily sport and exercise has increased by 58% since the 1970s, from 12 minutes per day in the 1970s to 19 minutes in the 2010s
- The average person watches TV or listens to the radio for 147 minutes per day, an increase of 37 minutes from time spent in the 1970s
- In the latest NHS figures, there were over 213,000 cases of Vitamin D deficiency
How Has Time Spent Changed Since The 1970s?
According to our analysis of the latest MTUS data, of the 1,440 minutes in a day, an average of just 3.7 hours (221) per day can be attributed to time ‘outdoors’, the equivalent to just 15% of a full day. In comparison, our time indoors is more than double that of ‘outdoors’ time, the equivalent of 35% of a 24 hour day.
Taking into account sleeping (36%) and working or in education (12%), for many working-age people (16-65), we spend upwards of 85% of our lives inside. A far cry from the amount of time our ancestors enjoyed.
Time Spent Outside
Taking into account various outdoor activities (or those that involve leaving the house and being outdoors for some time), our analysis of the MTUS data found there has been a 22% (61 minute) drop in the share of time spent outdoors by those of working age (16-65) between the years of 1974 and 2015.
However, whilst this provides a year snapshot, it only tells some of the story. Looking at the average time ‘outside’, our analysis found that between the 1970s and 2010s there has been a 14% (35 minute) drop in the time people take part in activities listed as involving “all or some outdoor time”.
Those under 30 (16-30), have seen the biggest drop in ‘outdoor’ time (20%), when compared to their age bracket in the 1970s, a fall of 54 minutes.
Though all the age groups analysed saw a drop in the fall in the time spent ‘outdoors’ those between the ages of 31 and 50 saw the smallest decrease (9%), followed by those between 50 and 65 (11%); 21 minutes and 28 minutes respectively.
The latest 12% drop in the percentage of time outdoors coincides with a 490% increase in Vitamin D deficiency diagnoses.
Time Spent Socialising & Going Out
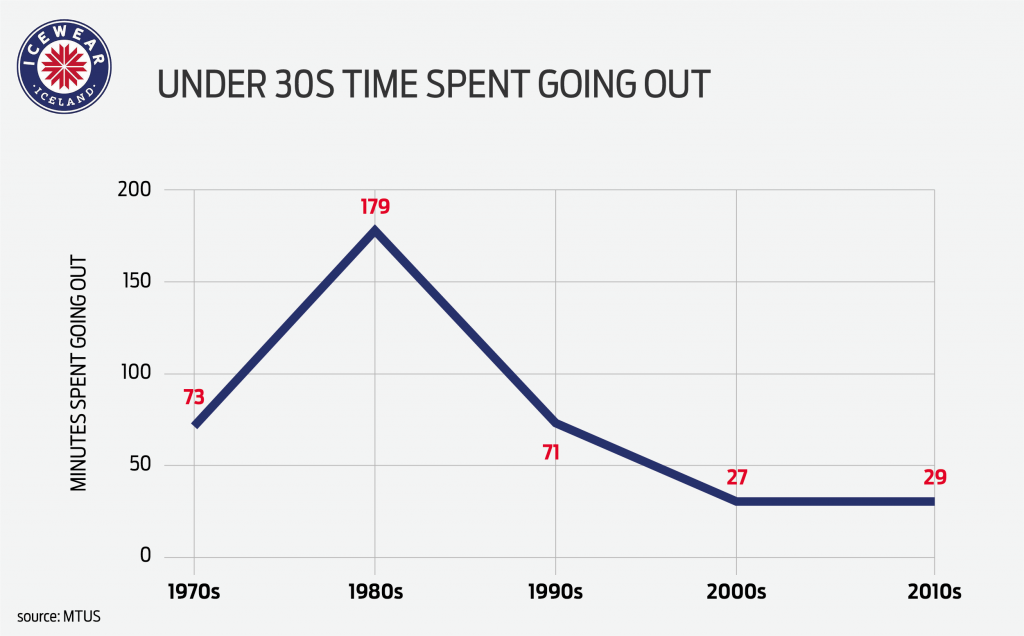
Younger generations partied twice as hard in the 70s than the 2010
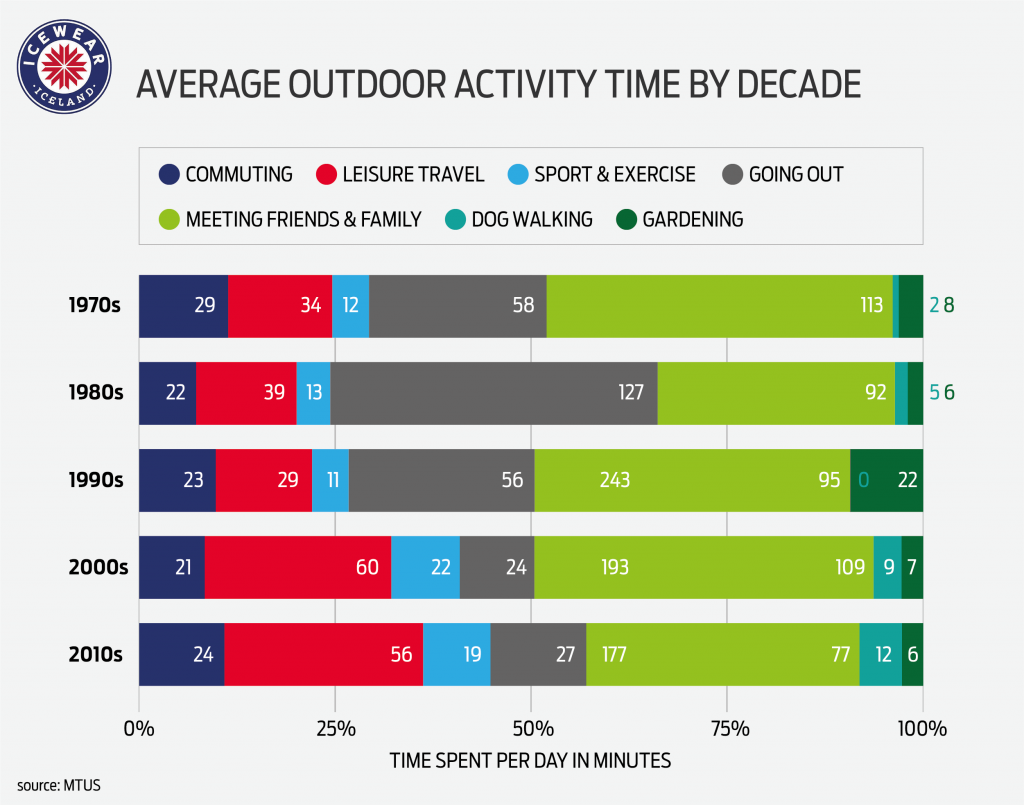
Studying the activities that involve “some or all the time outside”, we found meeting friends and family to be the most popular activity in the 2010s, with the average working-age person spending 77 minutes on average socialising with friends and family. Prior to the 2000s, ‘going out’ to concerts and events was traditionally the second most popular ‘outdoor’ activity. However, compared to the 1970s, working-age adults in the 2010s go out 53% (31 minutes) less than their 70s counterparts. This drop in ‘going out’ is even more noticeable in 16-30 age groups, where traditionally (in the 1970s) under 30s would ‘go out’ for the equivalent of 73 minutes per day. In the 2010s, the same age group only ‘goes out’ for the equivalent of 29 minutes per day - a drop of 60% in 40 years.
Time Spent Exercising
Daily sport and exercise have increased in the working-age population by 58% since the 1970s, with the average 16-65 year old now partaking in 19 minutes of sport as a daily average. Still, this is 11 minutes below the average 30 minutes of movement per day advised by doctors. However, for the under 30’s sport and exercise is still very important, with the average adult under the age of 30 taking part in 22 minutes of exercise, a 69% increase against their counterparts in the 1970s.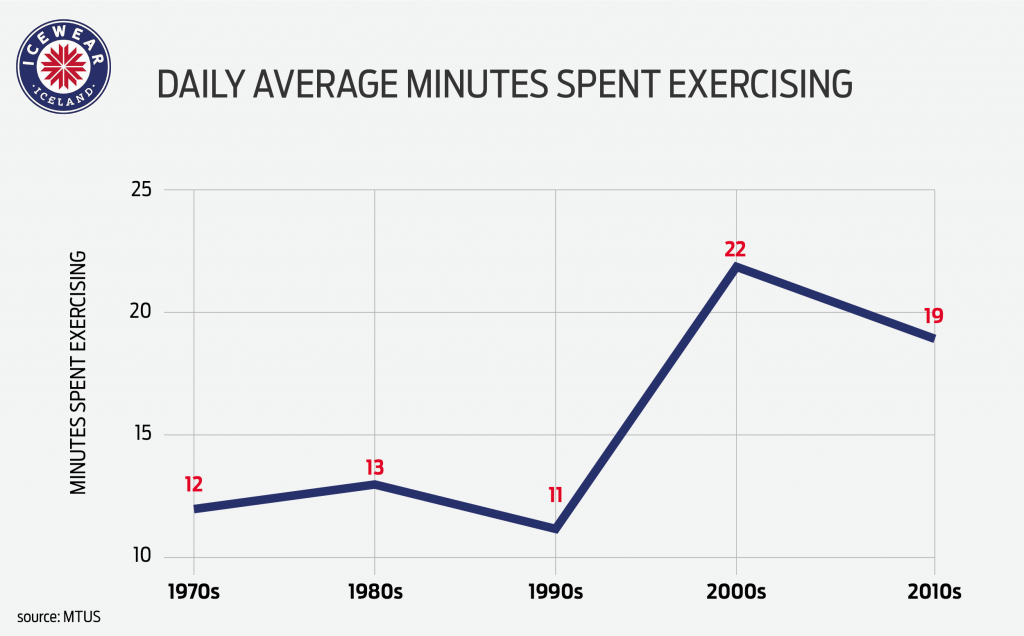
Time Spent Travelling
Whilst many of the activities that are in total or in part outside, have seen a drop in their numbers since the 1970s, leisure travelling has seen a boom. Since the 1970s, the average person has increased their time spent travelling by 65%. In the 2010s the average working adult spent the equivalent of 56 minutes travelling for leisure per day, compared to just 34 minutes in the 1970s.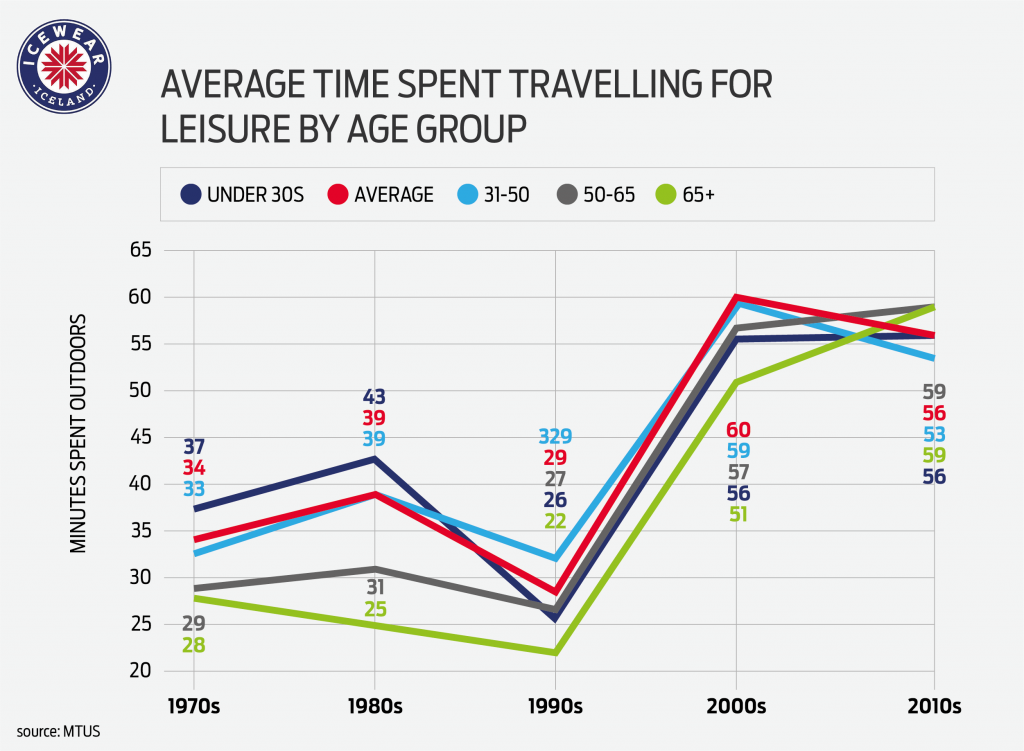
Increasing Vitamin D Deficiencies
Studies have linked our decreased sun exposure with increasing levels of vitamin D deficiency, which is a major concern for global health authorities. The importance of vitamin D cannot be overstated, with it long been linked to bone growth but also helping regulate the immune system and playing a vital role in the life cycle of our cells. Between the 2000s and 2010s, there has been a 490% increase in the primary (main reason for medical consult) cases of Vitamin D deficiency, rising from a total of 1,604 cases from 2000 to 2009, to 9,460 cases from 2010 to 2019.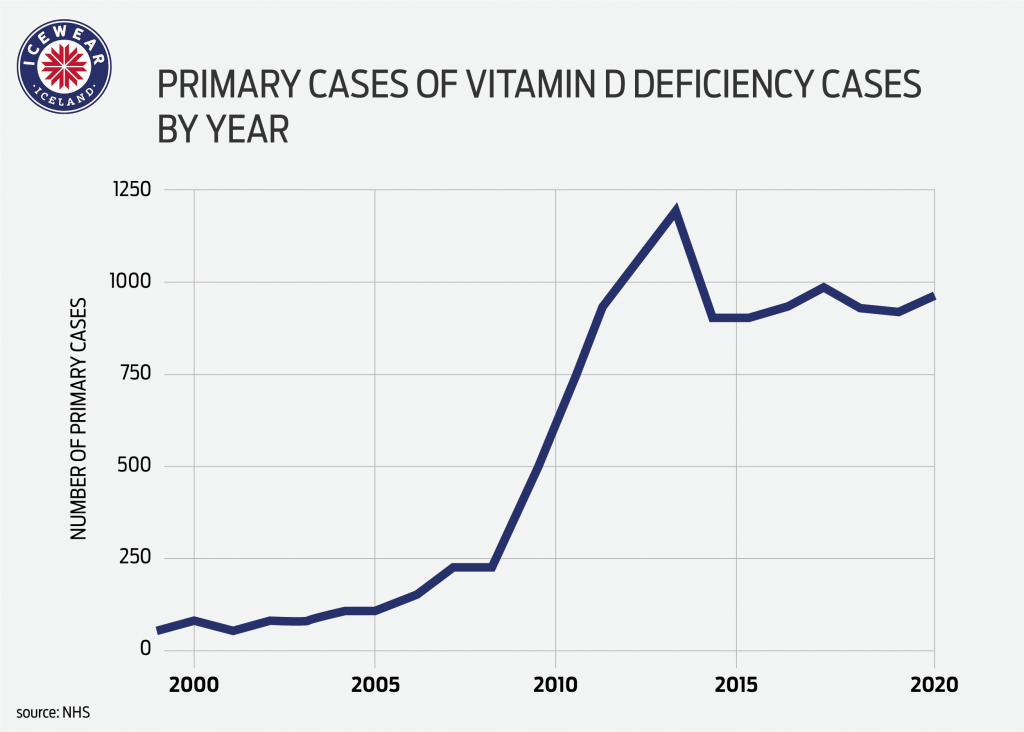 *However, when we compare the numbers of cases in 2000 (85) to 2019’s (965), we found diagnoses have increased by 987% in that time, at an average rate of 18% per year.*
Whilst primary diagnoses provide a snapshot of severe cases and their growth since 1999, the latest reports provide further insight into the numbers of diagnoses at primary and ‘total’ split.
Analysing the latest figures (between 2013 and 2020), we found “all” diagnoses of Vitamin D deficiency have increased from 36,912 to 213,297, an increase of 477%.
*However, when we compare the numbers of cases in 2000 (85) to 2019’s (965), we found diagnoses have increased by 987% in that time, at an average rate of 18% per year.*
Whilst primary diagnoses provide a snapshot of severe cases and their growth since 1999, the latest reports provide further insight into the numbers of diagnoses at primary and ‘total’ split.
Analysing the latest figures (between 2013 and 2020), we found “all” diagnoses of Vitamin D deficiency have increased from 36,912 to 213,297, an increase of 477%.
Time Spent Inside
While 15% of time is spent doing activities that are all or in part outdoors, 85% of working-age peoples lives are spent indoors. The two most time-consuming reasons for being indoors - somewhat unsurprisingly - are sleeping (36%) and working or in education (12%). Surprisingly, considering various reports on sleep being impacted by blue light-emitting devices, the amount of time the average working-age person sleeps has increased by 6% over the past 40 years, to a high of over 8.5 hours.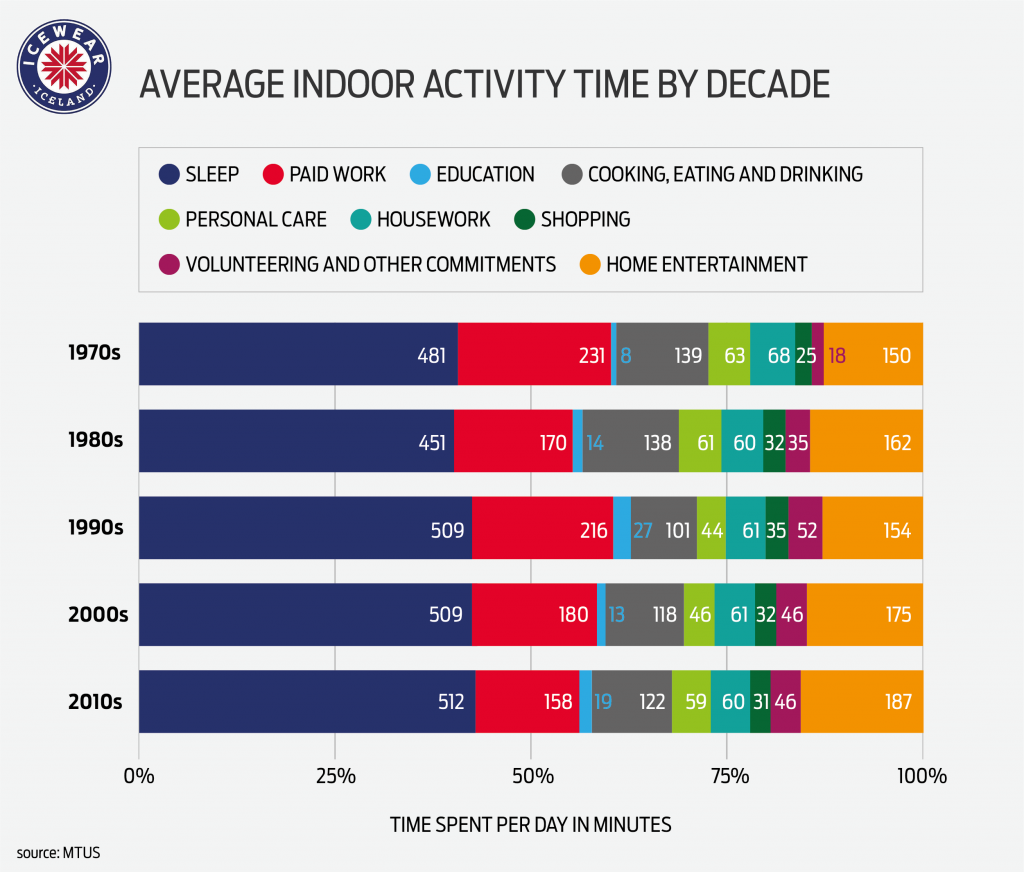
Time Spent In Work & Education
Whilst sleep has increased the minutes spent in paid work has decreased by 32%.In the 1970s the average working-age adult would spend an average of 231 minutes (just under 4 hours) in paid work each day. However, in the latest release of the MTUS, the average time in paid work in the 2010s had dropped to just 158 minutes (2.7 hours).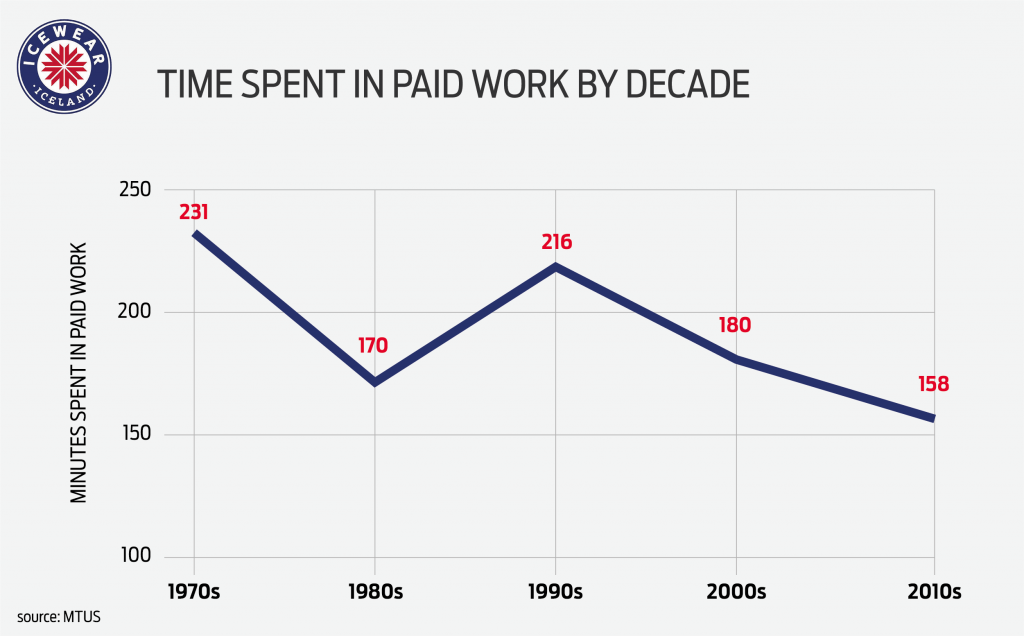 Some of this change can be attributed to more younger people spending longer in education rather than entering the workforce.
The figures analysed showed, since the 1970s, a 138% increase in the amount of time 16-65s spent daily in an educational activity, with those between the ages of 16 and 21 seeing a time spent in education increase of 180% (70 minutes).
Some of this change can be attributed to more younger people spending longer in education rather than entering the workforce.
The figures analysed showed, since the 1970s, a 138% increase in the amount of time 16-65s spent daily in an educational activity, with those between the ages of 16 and 21 seeing a time spent in education increase of 180% (70 minutes).
Time Spent Volunteering And Caring
In addition to paid work, many paid workers do some form of caring (whether for elderly friends and family or children) or volunteering of their time. Since the 1970s, the average working-age person now spends 190% more time volunteering or caring for a loved one. In the 1970s, the average 16-65-year-old person spent 20 minutes a day caring for a loved one or performing some type of volunteering, in the 2010s this has increased to 58 minutes per day.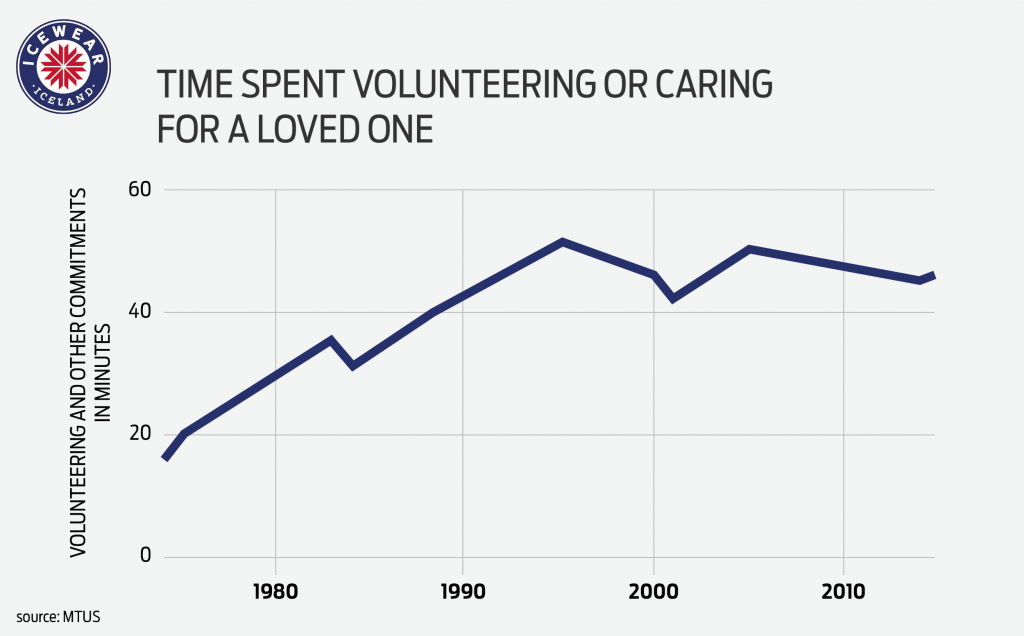
Time Spent In With Home Entertainment
Our analysis showed that since the 1970s there’s been a 37 minute (25%) increase in the amount of time people spend enjoying some form of home entertainment. Studying the home entertainment categories of TV & Radio, Reading and time online, the advent of personal computers and the boom of the computer age appear to be the main reason for the 25% rise. In the 1970s no (0) time was recorded as being online, however, by the 2010s “time online” had reached an average of 30 minutes in the working-age population. Conversely, time spent reading has fallen 19% in the past 40 years to just 14 minutes per day, whilst time watching TV or listening to the radio is up 8% to 147 minutes per day.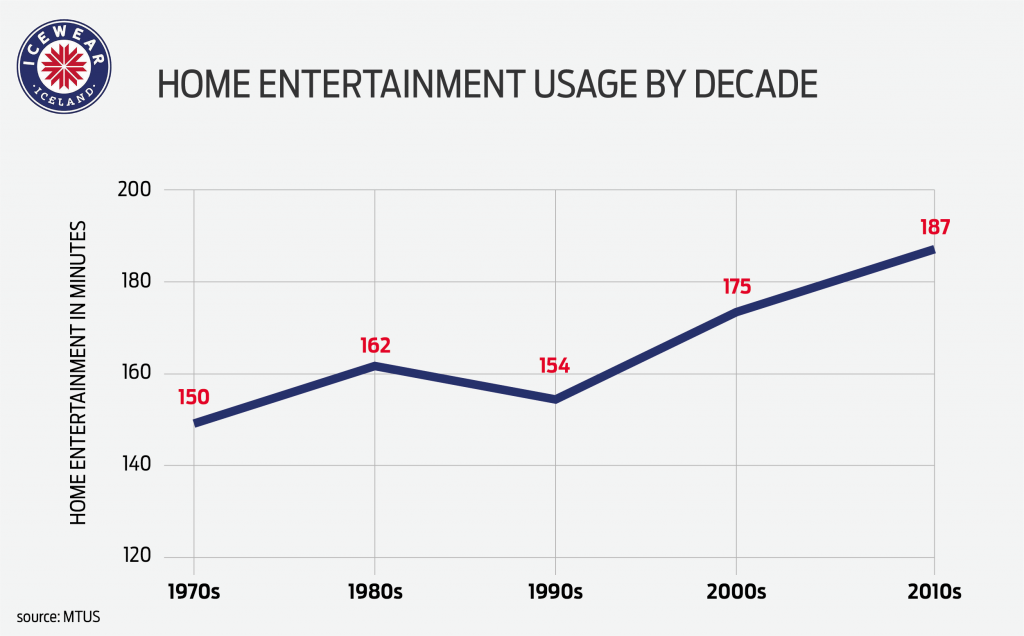 In response to the findings of our study, Harpa Gretarsdóttir, Brand manager here at Icewear comments:
“Our study shows that for many people their time outdoors has seen fall, with time spent each day consuming home entertainment increasing by 25%, to an average of 187 minutes (3.1 hours) per day.”
“With this in mind, along with fact, people are spending just 15% of their day in ‘outdoor’ activities, it is not too surprising to learn that Vitamin D deficiency cases have risen by 490% between the 2000s and 2010s.”
“Here in Iceland, to counter our dark winters that see our time outdoors greatly reduced, many people turn to fish oils (Lýsi) and vitamins to give them Vitamin D boosts they need to get through the months.”
“Icelanders will also look to take advantage of time outdoors when they can, either through exercising or generally getting out of the house to visit friends and for a change of scenery.”
In response to the findings of our study, Harpa Gretarsdóttir, Brand manager here at Icewear comments:
“Our study shows that for many people their time outdoors has seen fall, with time spent each day consuming home entertainment increasing by 25%, to an average of 187 minutes (3.1 hours) per day.”
“With this in mind, along with fact, people are spending just 15% of their day in ‘outdoor’ activities, it is not too surprising to learn that Vitamin D deficiency cases have risen by 490% between the 2000s and 2010s.”
“Here in Iceland, to counter our dark winters that see our time outdoors greatly reduced, many people turn to fish oils (Lýsi) and vitamins to give them Vitamin D boosts they need to get through the months.”
“Icelanders will also look to take advantage of time outdoors when they can, either through exercising or generally getting out of the house to visit friends and for a change of scenery.”